PDA Data Model
Decline Analysis Tables Description
| Table | Description |
|---|---|
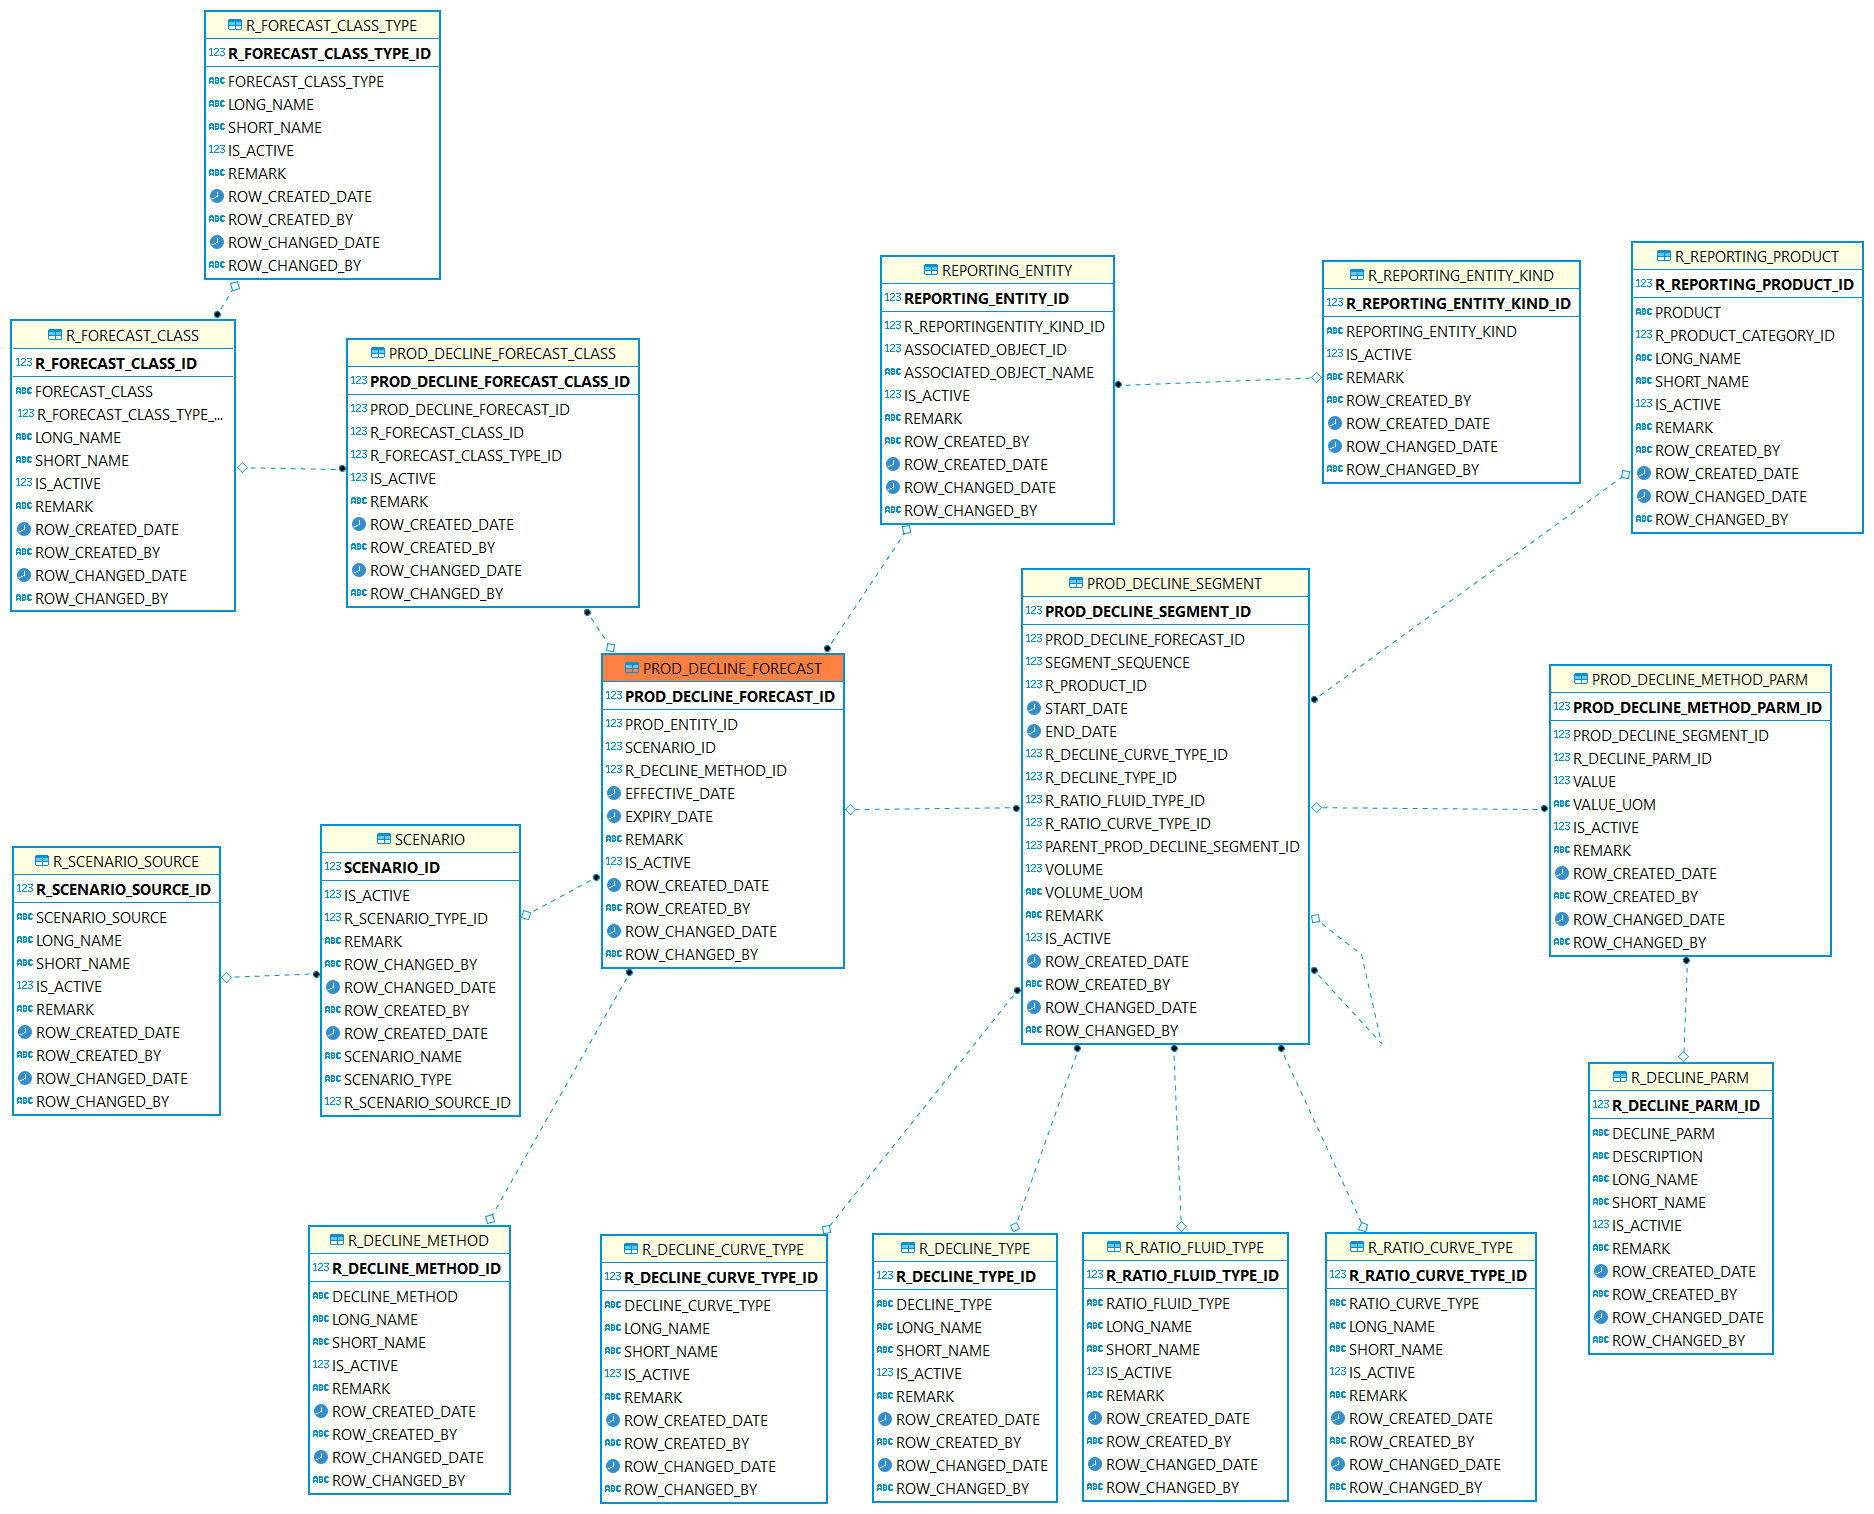
This table contains the information of an entire forecast. such as what entity forecast for, a well, pool, zone, or completion. what scenario it is belonging to, and what method is used. Effective/Expiry date for each forecast to clarify when this forecast is valid, and not valid. |
|
This table holds the individual segment parameter sets, along with the summary data for each segment. |
|
Use this table to capture the parameter settings for specific forecast segment. |
|
The method of decline curve analysis that is used in decline curve forecast. Such as Arps, Duong, SEPD, Power Law, Modified Arps, Customized. |
|
The type of decline curve that is used in decline curve forecast calculations such as exponential, harmonic, hyperbolic, linear, etc. |
|
The type of decline that is used in decline curve forecast calculations such as nominal or effective percentage. |
|
The type of ratio curve that is used in decline curve forecast calculations such as linear, semi-log, log-log, etc. |
|
The type of ratio fluid that is used in decline curve forecast calculations for GOR, YIELD, etc. |
|
Use this table to capture the parameters for any decline analysis method. This table may list a variety of parameter settings for each method, an actual analysis study method will use multiple parameters. |
|
This table contains classification information for forecast, such as status and authorized state. |
|
These classes may define the lifecycles states of the forecast (proposed, current, deprecated), the authorized state of the forecast (official, unofficial), the intent of the forecast (2005 budget, project proposal etc.) as well as other classification schemes. |
|
This table defines the classification schemes that can be defined for and applied to forecasts. |